Tape a Business Model Canvas or Lean Canvas on a wall, grab a large stack of post-it notes and pile of sharpies, invite all the stakeholders. That’s it! You’re ready to hold the first business modelling session for the product you’ve been assigned to help resurrect. You’ve done this before and you know that you’ll get a canvas filled with assumptions that you can then prioritize. You’re even ready to start that prioritization exercise using the Assumption Prioritization matrix.
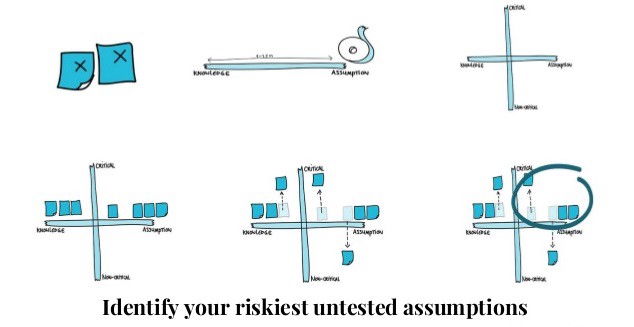
No doubt, starting here will put you ahead of most product resurrection and/or discovery initiatives. However, the scale of the x-axis in the 2×2 matrix above may cause concern. It’s easy enough to place assumptions on the x-axis that you have no knowledge about. They go all the way to the right. What about assumptions that you have slightly more knowledge about? Where should they go on the x-axis? Most important to the above exercise, which assumptions belong on the right vs the left side of the y-axis?
The above matrix doesn’t have a scale on the x-axis on purpose. It is not meant for you to agonize over the types of questions I’ve listed above. It’s meant to get you started with a prioritization, any prioritization, of your riskiest assumptions so you can start to collect data.

OK, so let’s say you run your session and you get a prioritized backlog of Riskiest Assumptions. You then dutifully begin to design a set of RATs — Riskiest Assumption Tests — to test the Riskiest Assumption and begin to collect data. As the evidence begins to mount in support or opposition of the RAT’s hypothesis, you know that you now know more about your initial assumption, but how much more? You can certainly go back to the 2×2 matrix and move the assumption you’ve been working on along the x-axis to the right, but to where?
A different application of The Unison Method
I wrote about adding The Unison Method to your Innovation Accounting arsenal of tools here. At the end of that post, I talked about the 90% Estimation Interval (EI) and how its “width” can help quantify the level of uncertainty in a specific variable of your business model’s profit formula.
I encourage you to give the aforementioned post a read to set the context. As a quick review, The Unsion Method uses a statistical tool called Monte Carlo to generate a visualization of the range of profit outcomes of a business model. The initial stage of the method takes the Revenue and Cost boxes from your business model and expresses them as a profit formula. Because the business model has uncertainty to it, some of the elements of the profit formula will be uncertain. For each of those uncertain variables, the method asks the estimator (the estimator must be calibrated, more on that in a future post) to provide a range that has a 90% chance of containing the true value of the thing being estimated. For example, the number of converted users or the number of purchases.
The 90% Estimation Interval
Let’s dig into the width of that 90% EI. Suppose you are trying to attract more customers in a market adjacent to the one you currently operate in by creating a new product feature. Perhaps it’s board game players that you’re creating an online game feature for or a pet medical insurance offering for your current disability insurance customers. You have very little idea how many of these customers you can attract with your new feature’s value proposition. Say you follow the process above to arrive at an assumption that might sound like “I think we can attract 20% of the adjacent market with our new feature”. Your group of stakeholders ranks this as the top riskiest assumption and you design the first RAT to test it. The data begins to flow in.
In parallel, you go through the steps of The Unison Method. You define a profit formula, you get calibrated and you estimate each uncertain variable in your profit formula including the acquisition rate of the customers in the adjacent market you are targeting. Once your stakeholders identify the acquisition rate as the riskiest assumption, you go back to your 90% EIs and you notice the following:
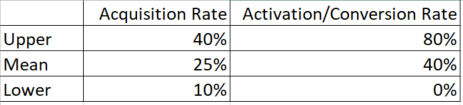
What looks more risky to you? The Acquisition Rate has a range that is 30% wide whereas the Activation/Conversion Rate has a width of 80%. It appears that we are far more certain that we can attract customers than we are in our ability to convert them into paying for the product once they’ve become aware of it.
Don’t get me wrong, this is all very subjective no matter what you use to start testing your assumptions. What’s most important is that you actually identify and test your assumptions. There are no awards for thinking about testing your assumptions, only for doing the hard work to test them. Getting started somewhere is much better than getting paralyzed in analysis and never progressing at all. However, if you’ve run a number of experiments and are unsure of the next riskiest assumption to test, using the width of the 90% EI can serve as a useful tool to give you increased insight into where that next riskiest assumption may lie and where the best bang for your experimentation buck is.
Suppose you change course and try to understand more about your Activation/Conversion Rate, instead of the Acquisition Rate, by designing and running a set of RATs. You collect evidence and find that you can update your Activation/Conversion Rate EI to an upper bound of 15% and a lower bound of 5% (from the original 80% to 0%). It has now become clear that your Acquisition Rate is, in this limited relative case, the much more risky assumption given that the range of its EI is wider and, therefore, more uncertain.
How do you prioritize your business model assumptions? What tools do you use? I’d love your thoughts on using the 90% EI.
Happy business model de-risking!